This interactive map highlights (through colour shading) the relative richness of bird species across the catchment. Each of the 236 Tetrads is shown and by clicking on each Tetrad the map brings up headline data:
- Tetrad reference
- Tetrad name
- Number of records for the Tetrad
- Full species list for the Tetrad
Click in the top right corner to remove the bird data and get a simple catchment map
Zoom in to get greater resolution on the baseline map for each Tetrad and/or a specific area.
Individual species maps are accessed via the species pages.
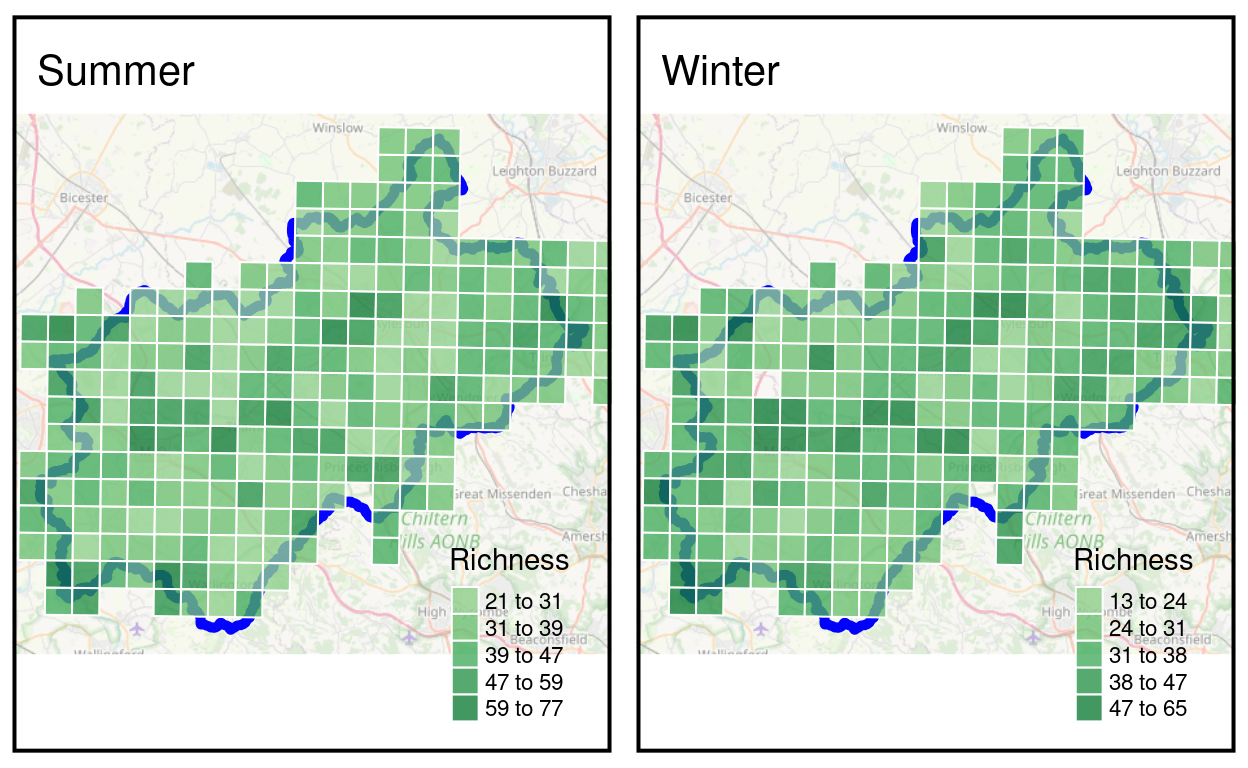
Two static maps show the relative richness (through colour shading) of bird species in the winter and in the summer. These maps can be downloaded by right clicking on the maps and copying the image.
Seasonal Distribution
The maps below show the presence of all species in each tetrad in summer (the breeding season) and winter respectively. Details for each species are available on the species pages.